Essay
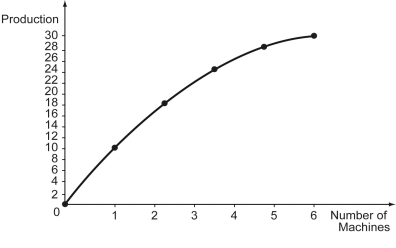
The following figure depicts a specific firm's production with respect to the number of machine used.
-Refer to Charles and Guryan's study of wage data reported in Evidence-Based Economics segment in the textbook.They have found that there is a gap in wages between African-Americans and Caucasian-Americans.
a)How much of the gap is attributed to discrimination?
b)What other factors did the economists consider as possible causes for the gap? Why is it important to consider other factors?
c)Is the discrimination found in the study taste-based or statistical?
Correct Answer:

Verified
a) As much as 25 percent of the differen...View Answer
Unlock this answer now
Get Access to more Verified Answers free of charge
Correct Answer:
Verified
View Answer
Unlock this answer now
Get Access to more Verified Answers free of charge
Q86: A firm has to decide on the
Q87: The condition determining the optimal amount of
Q88: Scenario: Mark grows herbs in his backyard.
Q89: The following figure shows price versus demand
Q90: Suppose that,on average,women are less likely to
Q92: The following figure depicts an individual's supply
Q93: Assume that both the goods and the
Q94: Suppose the market wage facing a firm
Q95: Technological changes that increase the productivity of
Q96: The following figure shows price versus demand