Multiple Choice
The figure below shows the demand curve in a monopoly market.
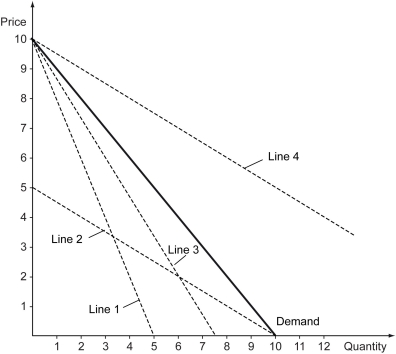
-Refer to the figure above.This monopolist initially produced 6 units and now has a new plan to produce 8 units of this good.The price effect of this plan on the revenue of the monopolist is ________.
A) $3
B) +$6
C) $1
D) +$7
Correct Answer:

Verified
Correct Answer:
Verified
Q140: Which of the following is an example
Q141: Which of the following statements is true?<br>A)
Q142: Scenario: Tobac Co. is a monopolist in
Q143: If the marginal revenue of a producer
Q144: For a profit-maximizing monopolist,profits are given by
Q146: When price discrimination does not increase output,it
Q147: The supply curve for a monopolist is
Q148: At the profit-maximizing level of output and
Q149: What are the types of market power?
Q150: Scenario: When a monopolist charges $10 for