Multiple Choice
The following figure shows the demand curve faced by a monopolist.
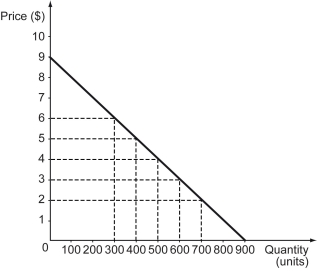
-Refer to the figure above.What is the quantity effect of a price increase from $3 to $5?
A) $200
B) $600
C) $800
D) $1,000
Correct Answer:

Verified
Correct Answer:
Verified
Related Questions
Q182: The following table shows the quantities of
Q183: The following figure is a supply-demand diagram
Q184: At a certain level of production,the marginal
Q185: Firm A is a monopoly because of
Q186: Which of the following statements correctly identifies
Q188: Which of the following market structures provides
Q189: Which of the following statements explains why
Q190: A _ is the privilege granted to
Q191: If a monopolist owns or controls a
Q192: The following table shows the different quantities