Multiple Choice
The following figure shows the marginal revenue (MR) and demand curves faced by a monopolist.
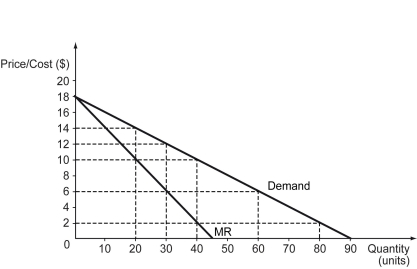
-Refer to the figure above.If the monopolist faces a constant marginal cost of $10,what is the optimal quantity that it should produce?
A) 20 units
B) 30 units
C) 40 units
D) 80 units
Correct Answer:

Verified
Correct Answer:
Verified
Q149: What are the types of market power?
Q150: Scenario: When a monopolist charges $10 for
Q151: The following figure shows the market demand
Q152: Fair-returns pricing describes a situation in which
Q153: Which of the following is not an
Q155: Which of the following statements is true?<br>A)
Q156: A key resource is a material that
Q157: A socially optimal price regulation will NOT
Q158: The main source of natural market power
Q159: The following figure shows the demand (D),