Essay
The following figure shows the demand curve and the marginal revenue (MR)curve of a monopolist supplying petroleum.
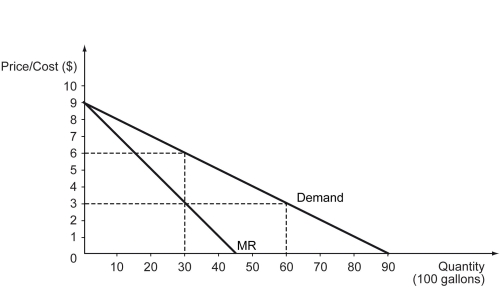
a)If the monopolist faces a constant marginal cost of $3,what is the optimal output that it should produce?
b)If the monopolist faces a constant marginal cost of $3,at what price should it sell the optimal output?
c)If the average total cost of the monopolist is $4 per gallon when it produces the optimal output,determine its profit or loss.
Correct Answer:

Verified
a) The optimal output of a monopolist is...View Answer
Unlock this answer now
Get Access to more Verified Answers free of charge
Correct Answer:
Verified
View Answer
Unlock this answer now
Get Access to more Verified Answers free of charge
Q246: Scenario: Tobac Co. is a monopolist in
Q247: The following figure shows the marginal revenue
Q248: For a firm with market power,the price
Q249: The following table shows the quantities of
Q250: When the price of the same product
Q252: Natural monopolies are characterized by facing a(n)_.<br>A)
Q253: A certain amusement park offers a 50
Q254: Scenario: Tobac Co. is a monopolist in
Q255: Which of the following statements is true?<br>A)
Q256: As a firm increases its output,its average