Multiple Choice
The figure below shows the cost and revenue curves of a firm in a monopoly market.
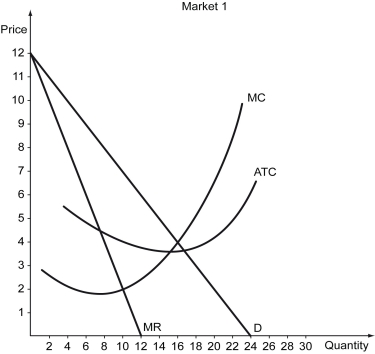
-Refer to the figure above.How much would this monopolist charge for its product?
A) $2
B) $3.50
C) $4
D) $7
Correct Answer:

Verified
Correct Answer:
Verified
Related Questions
Q111: Over a particular price range,if the quantity
Q112: _ is a market structure where only
Q113: Scenario: Tobac Co. is a monopolist in
Q114: U)S.Code Title 18 § 1696 states<br>Whoever establishes
Q115: Which of the following is true of
Q117: A market structure in which there is
Q118: The total revenue curve of a monopolist
Q119: Price discrimination is never perfect because it
Q120: Scenario: Tobac Co. is a monopolist in
Q121: Scenario: The following excerpt is from "Throwing