Multiple Choice
The following figure shows the marginal revenue (MR) and average total cost (ATC) and marginal cost (MC) curves of a monopolist.
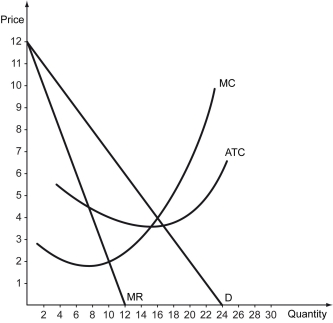
-Refer to the figure above.The output produced in this market is ________ units,while the output produced under a comparable perfectly competitive market would have been ________ units.
A) 12; 17
B) 10; 17
C) 12; 24
D) 10; 16
Correct Answer:

Verified
Correct Answer:
Verified
Q87: Scenario: Tobac Co. is a monopolist in
Q88: A monopoly produces and sells 300 units
Q89: The following figure shows the marginal revenue
Q90: The quantity effect of a price decrease
Q91: Which of the following is true of
Q93: For a monopolist,_.<br>A) Marginal revenue > Price<br>B)
Q94: Scenario: Mr. Olivander has a monopoly on
Q95: The following figure shows the market demand
Q96: Which of the following statements is true?<br>A)
Q97: Perfect price discrimination is also referred to