Multiple Choice
The following figure shows the market demand curve for penicillin, an antibiotic medicine. Initially, the market was supplied by perfectly competitive firms. Later, the government granted the exclusive right to produce and sell penicillin to one firm. The figure also shows the marginal revenue curve (MR) of the firm once it begins to operate as a monopoly. The marginal cost is constant at $3, irrespective of the market structure.
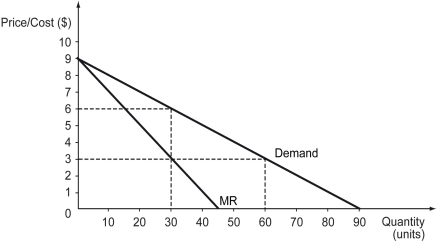
-Refer to the figure above.What is the quantity supplied in the market when the market is supplied by one firm?
A) 30 units
B) 45 units
C) 60 units
D) 90 units
Correct Answer:

Verified
Correct Answer:
Verified
Q14: A firm's objective behind charging different prices
Q15: Scenario: When a monopolist charges $5 for
Q16: The following figure shows the market demand
Q17: When a firm obtains market power through
Q18: _ refers to the ability of sellers
Q20: Differentiate between a patent and a copyright.
Q21: The following figure shows the demand curve
Q22: Scenario: Tobac Co. is a monopolist in
Q23: The following figure shows the demand (D),
Q24: The following figure shows the costs and