Multiple Choice
The following figure shows the cost curves (ATC, average total cost; MC, marginal cost) of a firm that operates in a monopolistic competition market, as well as the demand (D) facing the firm and the marginal revenue (MR) of this firm.
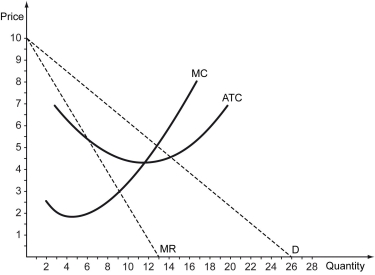
-Refer to the figure above.What is the profit-maximizing price that this firm should charge in the short run?
A) $3
B) $4.50
C) $6.50
D) $4
Correct Answer:

Verified
Correct Answer:
Verified
Q87: The following table shows a firm's total
Q88: There are two firms in an industry,and
Q89: Scenario: Two firms, Firm 1 and Firm
Q90: Scenario: The market demand for soccer balls
Q91: Suppose a monopolistic competitor produces 1,250 units
Q93: Which of the following is a difference
Q94: An oligopoly market with differentiated products is
Q95: The following figure shows the cost curves
Q96: Which of the following is true?<br>A) A
Q97: Differentiated products can be found in _.<br>A)