Multiple Choice
The following figure shows the demand curve (DD) , the marginal revenue curve (MR) , and the cost curves of a monopolistic competitor.
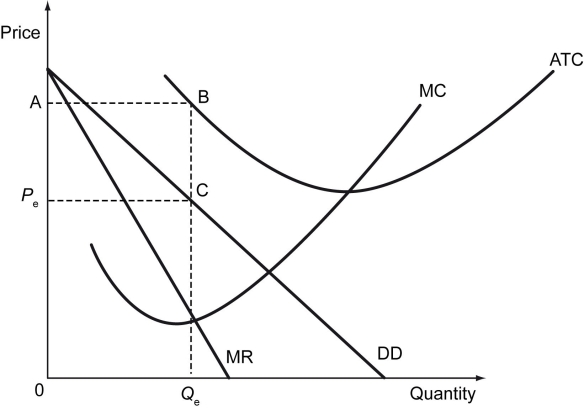
-Refer to the figure above.What does the region ABCPₑ denote?
A) An economic profit
B) A loss incurred by the producer
C) Consumer surplus
D) Deadweight loss
Correct Answer:

Verified
Correct Answer:
Verified
Q113: Why do some firms in an oligopoly
Q114: Why does a monopolistically competitive industry result
Q115: Suppose a monopolistically competitive industry has five
Q116: Markets in which the Herfindahl-Hirschman Index _
Q117: Scenario: The market demand for soccer balls
Q119: Which of the following is a difference
Q120: Crisps and Smith's are the only two
Q121: The market for apples is an example
Q122: Which of the following happens when new
Q123: Why do firms enter into a collusive