Essay
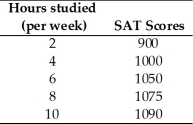
-Jamie is preparing to take his SAT tests.The table above shows how Jamie's score depends on the number of hours a week Jamie studies
a.Plot the relationship in the figure,putting the hours studied on the horizontal axis.
b.Is the relationship you plotted positive or negative?
c.What happens to the slope of the relationship as hours studied increase?
d.Suppose Jamie can enroll in an SAT prep course and,by so doing,for every possible number of hours he studies,his score will be 100 points higher.Plot the new relationship between the number of hours studied and Jamie's SAT score in the figure.
e.How many variables are involved in the figure you just completed?
Correct Answer:

Verified

a.The figure above plots the relations...View Answer
Unlock this answer now
Get Access to more Verified Answers free of charge
Correct Answer:
Verified
a.The figure above plots the relations...
View Answer
Unlock this answer now
Get Access to more Verified Answers free of charge
Q18: What is the difference between microeconomics and
Q99: If the marginal benefit of the next
Q119: <img src="https://d2lvgg3v3hfg70.cloudfront.net/TB1456/.jpg" alt=" -What is the
Q120: <img src="https://d2lvgg3v3hfg70.cloudfront.net/TB1458/.jpg" alt=" -The relationship between
Q147: The opportunity cost of a one-unit increase
Q206: <img src="https://d2lvgg3v3hfg70.cloudfront.net/TB1456/.jpg" alt=" -Graph the data
Q273: When the power company decides to use
Q295: Which of the following BEST describes macroeconomics?<br>A)
Q340: If the change in y = -4
Q345: Correlation means<br>A) holding everything else constant.<br>B) after