Multiple Choice
The graph here shows the number of undecayed nuclei as a function of time for a radioactive element. The half-life of this particular radioisotope is 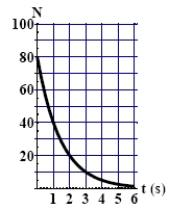
A) 1.0 s.
B) 2.0 s.
C) 4.0 s.
D) 6.0 s.
E) More information is needed to work out the answer.
Correct Answer:

Verified
Correct Answer:
Verified
Related Questions
Q30: When <sup>238</sup>U emits an <span
Q31: The nuclear radius of <sup>64</sup>Co is approximately<br>A)
Q32: Compared to atomic energies, nuclear energies are<br>A)
Q33: A 300-g sample of <sup>218</sup>Po undergoes
Q34: Which of the following is most likely
Q36: A sample of <sup>131</sup>I (which has a
Q37: As a radioactive substance decays, its half-life<br>A)
Q38: The density of nuclear matter is of
Q39: If 30 g of substance remain from
Q40: The graphs here show the number of