Multiple Choice
The graphs here show the number of undecayed nuclei as a function of time for a radioactive element. The graph corresponding to elements having the smaller decay constant is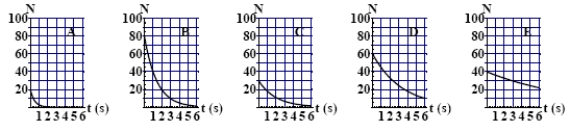
A) A
B) B
C) C
D) D
E) E
Correct Answer:

Verified
Correct Answer:
Verified
Related Questions
Q1: The nuclear radius of <sup>27</sup>Co is approximately<br>A)
Q3: The significant forces in determining the structure
Q4: In a <span class="ql-formula" data-value="{
Q5: The number of <sup>131</sup>I (half-life of 8.04
Q6: During <span class="ql-formula" data-value="\beta ^
Q7: The radioactivity of a certain radioisotope decreases
Q8: The graphs here show the number of
Q9: The graph here shows the number of
Q10: If the parent nucleus has N
Q11: If 40 g of substance of half-life