Multiple Choice
The figure here shows a graph of the electric potential (independent of y and z) versus x in a certain region of space. The x component of the corresponding electric field at x = -2.0 cm is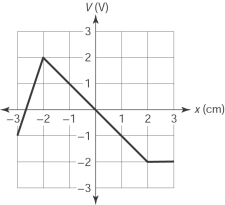
A) 3.0 N/C.
B) -3.0 N/C.
C) undefined.
D) -1.0 N/C.
E) 1.0 N/C.
Correct Answer:

Verified
Correct Answer:
Verified
Related Questions
Q6: If the electrostatic potential at a point
Q7: A charge +q<sub>1</sub> is brought to a
Q8: The electric potential due to a dipole
Q9: A uranium nucleus fissions in two spherical
Q10: A charge q is moved a
Q12: A charge +q<sub>1</sub> is brought to a
Q13: Two concentric conducting spherical shells have radii
Q14: The difference in electric potential between the
Q15: For an equipotential surface, all of the
Q16: The figure here shows the equipotential lines