Multiple Choice
The graph here represents a p-V diagram where the x axis is the volume in units of 10-3 m3 and the y axis is the pressure in units of 105 N/m2. The work done by the ideal gas as it follows the path sequence (p1,V1) to (p2,V2) to (p3,V3) to (p1,V1) along the lines indicated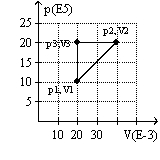
A) is 0 J.
B) is 10 kJ.
C) is -10 kJ.
D) cannot be determined from the given information.
Correct Answer:

Verified
Correct Answer:
Verified
Q30: The perpetual motion machine of the second
Q31: During an adiabatic expansion<br>A) Q > 0
Q32: An ideal gas is compressed at a
Q33: A heat engine works between two heat
Q34: The entropy of a closed system will<br>A)
Q36: During an isothermal process involving an ideal
Q37: The metric unit associated with the amount
Q38: The metric unit associated with the efficiency
Q39: A heat engine has an efficiency of
Q40: One-quarter of the energy a heat engine