Multiple Choice
The curve that correctly represents the relationship between the Fahrenheit and Celsius scales in a temperature (oF) versus temperature (oC) graph is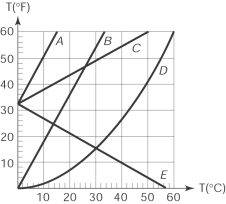
A) A
B) B
C) C
D) D
E) E
Correct Answer:

Verified
Correct Answer:
Verified
Related Questions
Q17: The molecules of a five-particle gas have
Q18: The quantity that changes when we measure
Q19: Oxygen is delivered to hospitals in
Q20: When the average speed of the
Q21: The ranking of the thermal energies of
Q23: Charles' Law states that<br>A) P.T = constant.<br>B)
Q24: After we place ice in a glass
Q25: The molecules of a five-particle gas have
Q26: Each of the lungs holds 2.0
Q27: The equivalent of the root-mean-square speed for