Multiple Choice
Identify each graph below as correct or incorrect. Describe what is wrong with each incorrect one.
-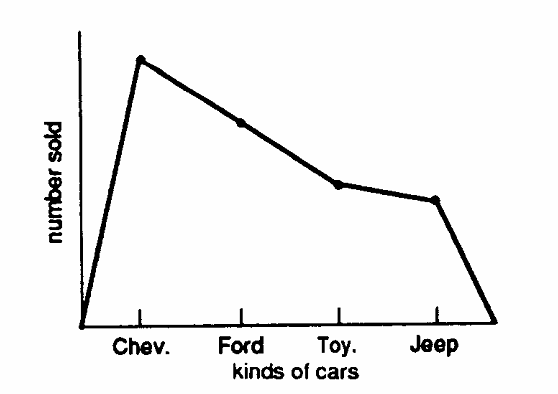
A) correct
B) incorrect
Correct Answer:

Verified
Correct Answer:
Verified
Related Questions
Q84: A frequency polygon and a histogram are
Q85: Which of the following class intervals has
Q86: Describe each figure below as a frequency
Q87: When a curve has a shape with
Q88: The cheerleaders at Rock Valley Tech had
Q89: A line graph shows the relationship between
Q90: The best way to determine if a
Q92: Grouped frequency distributions have class intervals that
Q93: Describe each figure below as a frequency
Q94: Suppose you had frequency counts of people