Multiple Choice
Describe each graph below as correct or incorrect. Tell what is wrong with the incorrect one(s) .
-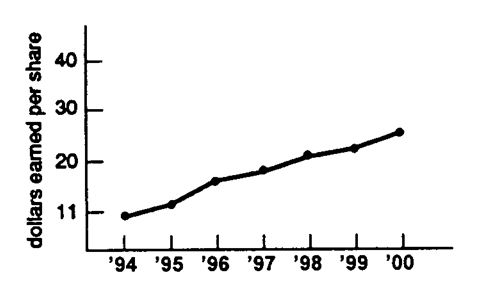
A) correct
B) incorrect
Correct Answer:

Verified
Correct Answer:
Verified
Related Questions
Q66: Your text shows a template that gives
Q67: Data Set 2-3 The graph in Data
Q68: Identify the skew of the two
Q69: Describe what the following graphs are used
Q70: A rough-draft grouped frequency distribution is characterized
Q72: Identify the skew of each distribution
Q73: The normal distribution is a special case
Q74: Graphs are popular because they<br>A) allow comparisons
Q75: The development of graphics as we know
Q76: Identify each graph below as correct or