Multiple Choice
Describe each graph below as correct or incorrect. Tell what is wrong with the incorrect one(s) .
-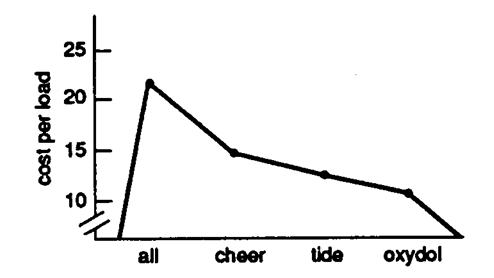
A) correct
B) incorrect
Correct Answer:

Verified
Correct Answer:
Verified
Related Questions
Q21: Your text says that the primary use
Q22: <img src="https://d2lvgg3v3hfg70.cloudfront.net/TB9561/.jpg" alt=" -The distribution in
Q23: A distribution shaped like a box is
Q24: Describe each figure below as a frequency
Q25: Identify each graph below as correct or
Q27: Bar graphs are used more extensively in
Q28: The serial position effect was displayed in
Q29: <img src="https://d2lvgg3v3hfg70.cloudfront.net/TB9561/.jpg" alt=" -Referring to Data
Q30: A group of American college students named
Q31: The administration at Warmfuzzy University gave