Multiple Choice
Describe each graph below as correct or incorrect. Tell what is wrong with the incorrect one(s) .
-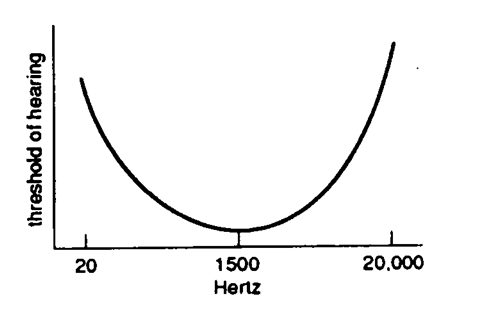
A) correct
B) incorrect
Correct Answer:

Verified
Correct Answer:
Verified
Related Questions
Q77: To show the relationship between serial position
Q78: To graph the relationship between age and
Q79: A line graph is used<br>A) in place
Q80: Describe each figure below as a frequency
Q81: The numbers in this problem are
Q83: The graphic in the text showing the
Q84: A frequency polygon and a histogram are
Q85: Which of the following class intervals has
Q86: Describe each figure below as a frequency
Q87: When a curve has a shape with