Multiple Choice
Data Set 13-10: The bar graphs show the results of Experiment X and Experiment Y. Each bar is based on a sample of 8.
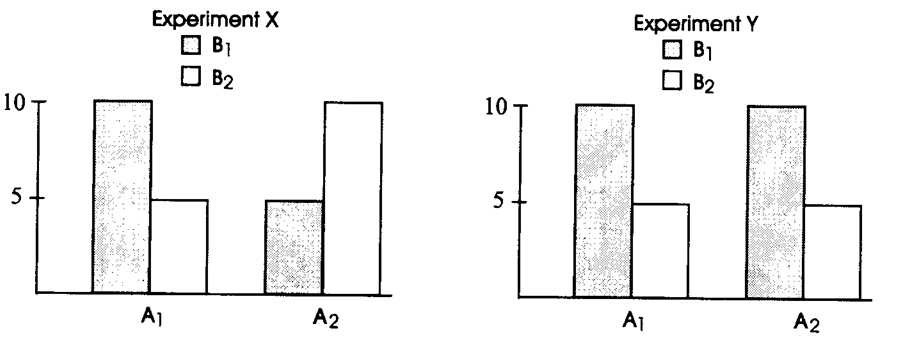
-In Data Set 13-10, there appears to be an interaction in Experiment
A) X
B) Y
C) both X and Y
D) neither X nor Y.
Correct Answer:

Verified
Correct Answer:
Verified
Related Questions
Q37: In a 4 x 5 factorial design
Q38: Data Set 13-2<br>Numbers in the cell
Q39: For her Research Methods project, Laura
Q40: In testing for a main effect using
Q41: A factorial ANOVA producesF tests.<br>A) one<br>B) two<br>C)
Q43: Data Set 13-4: The number in
Q44: In a factorial experiment on two independent
Q45: Besides the assumptions that are also required
Q46: The sum of squares for cells is
Q47: With respect to the number of independent