Multiple Choice
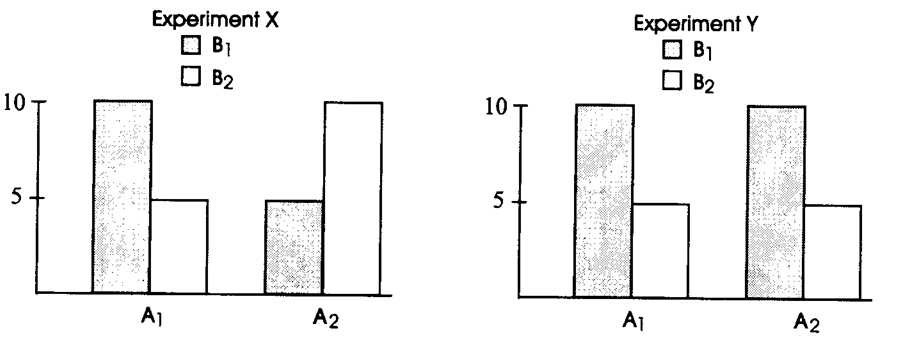
Data Set 13-10: The bar graphs show the results of Experiment X and Experiment Y. Each bar is based on a sample of 8.

-In Data Set 13-10, the main effect for A appears to be significant in Experiment
A) X
B) Y
C) both X and Y
D) neither X nor Y.
Correct Answer:

Verified
Correct Answer:
Verified
Related Questions
Q126: The factorial ANOVA described in Chapter 13
Q127: Data Set 13-5: An F value of
Q128: Data Set 13-4: The number in
Q129: Which of the following is not a
Q130: In a 3 x 6 factorial ANOVA
Q132: A histogram graphing an interaction that is
Q133: Data Set 13-9: Each point represents a
Q134: When the cell means of a factorial
Q135: Data Set 13-2<br>Numbers in the cell
Q136: A factorial ANOVA can analyze two independent