Multiple Choice
Data Set 13-10: The bar graphs show the results of Experiment X and Experiment Y. Each bar is based on a sample of 8.
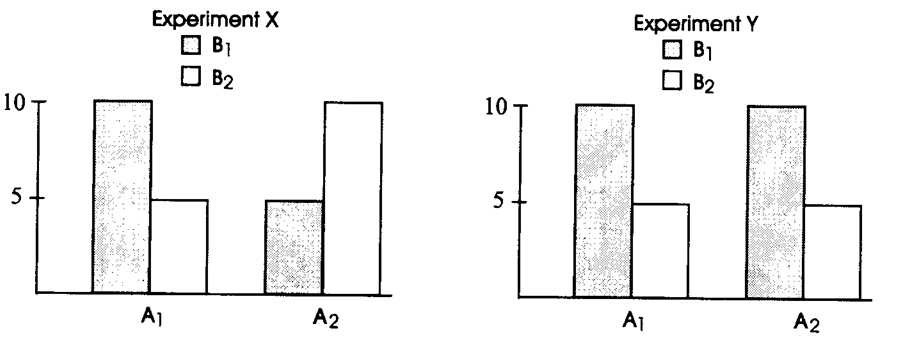
-The degrees of freedom for the interaction in Experiment Y in Data Set 13-10 are
A) 4, 40
B) 2, 37
C) 1, 36
D) 1 , 28
Correct Answer:

Verified
Correct Answer:
Verified
Related Questions
Q91: If you clean the fuel injectors of
Q92: In a factorial ANOVA, a comparison among
Q93: Suppose a 5 x 6 factorial
Q94: Data Set 13-4: The number in
Q95: An experimental psychologist thought that there was
Q97: Data Set 13-7: A political scientist reported
Q98: A cell in a factorial ANOVA refers
Q99: A factorial ANOVA produces three F values.
Q100: Data Set 13-2<br>Numbers in the cell
Q101: Data Set 13-1: An F value of