Multiple Choice
Using the supply and demand curves shown in the graph that follows, what is the equilibrium price for soft drinks? 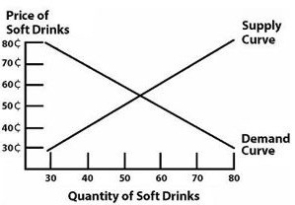
A) 35 cents
B) 45 cents
C) 50 cents
D) 55 cents
E) 75 cents
Correct Answer:

Verified
Correct Answer:
Verified
Related Questions
Q23: Which is the BEST example of a
Q24: A county encourages individuals to own and
Q25: Trevor owns a local farm stand. Although
Q26: Jeff is an entrepreneur who decided to
Q27: Amit hired an attorney to help him
Q29: Fabulous Fitness has a new exercise video
Q30: Allie, the manager of a new pet
Q31: Define business ethics. Describe the role of
Q32: Describe the pre-industrial economic phase of the
Q33: In Norway, most citizens are able to