Multiple Choice
The table below represents Freedonia's macroeconomic data for Year 1 and Year 2. 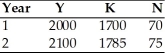
Suppose that the production function is given by Y = AK0.25N0.75.Between Year 1 and Year 2,total factor productivity of Freedonia's economy increased by
A) -1.5%.
B) 5) 0%.
C) 5) 5%.
D) 12.7%.
Correct Answer:

Verified
Correct Answer:
Verified
Q94: An invention that speeds up the Internet
Q95: Suppose the economy's production function is Y
Q96: Assume that the full-employment level of output
Q97: A decrease in the number of workers
Q98: An increase in the real wage would
Q100: A supply shock that reduces total factor
Q101: An adverse supply shock would<br>A)shift the production
Q102: The income effect of a higher real
Q103: Research on labor supply generally shows that<br>A)labor
Q104: Because of diminishing marginal productivity<br>A)the labor supply