Not Answered
What type of graph is shown below? Would this graph make an effective presentation aid? Why or why not? 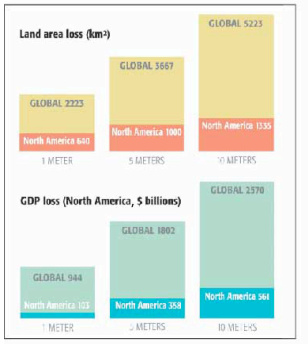
Correct Answer:

Verified
Correct Answer:
Verified
Related Questions
Q1: Which of the following is NOT an
Q2: Explain the advantages of using presentation aids
Q4: When should you use an organizational chart
Q5: Which of the following is NOT an
Q6: Betty is creating a graph using numerical
Q7: It is best to use chalkboards and
Q8: What are the steps involved in storyboarding
Q9: Donna is using consistent backgrounds, fonts, symbols,
Q10: Which of the following is NOT a
Q11: If you want to show the growth