Multiple Choice
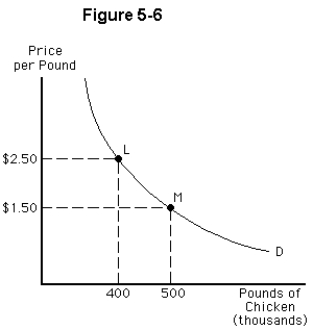
-Figure 5-6 shows the demand curve for chicken.Between points L and M,the price elasticity of demand is
A) 0.44,and demand is elastic
B) 0.44,and demand is inelastic
C) 2.25,and demand is elastic
D) 2.25,and demand is inelastic
E) 0.028,and demand is inelastic
Correct Answer:

Verified
Correct Answer:
Verified
Q29: The supply of a good is more
Q30: <img src="https://d2lvgg3v3hfg70.cloudfront.net/TB3973/.jpg" alt=" -Figure 5-1 shows
Q31: The sensitivity of one economic variable to
Q32: <img src="https://d2lvgg3v3hfg70.cloudfront.net/TB3973/.jpg" alt=" -Bill's Office Furniture
Q33: If demand is perfectly elastic,then<br>A)the demand curve
Q35: A local store noticed that when it
Q36: If the demand curve is a horizontal
Q37: If the demand curve is a straight
Q38: The cross-price elasticity of demand is useful
Q39: If the price of a good increases