Multiple Choice
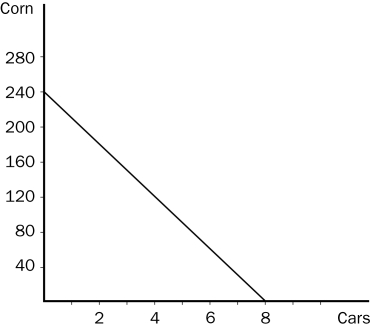
Figure 3-5 The graph below represents the various combinations of cars and corn that Country A could produce in a given month. (On the vertical axis, corn is measured in bushels.)

-Refer to Figure 3-5.The graph that is shown is called a
A) supply line.
B) opportunity line.
C) production possibilities frontier.
D) consumption possibilities frontier.
Correct Answer:

Verified
Correct Answer:
Verified
Q33: Travis can mow a lawn in two
Q47: Which of the following statements is not
Q114: Jonathan can make a birdhouse in 3
Q171: A country's consumption possibilities frontier can be
Q173: Figure 3-1<br> <img src="https://d2lvgg3v3hfg70.cloudfront.net/TB2178/.jpg" alt="Figure 3-1
Q174: For the following question(s), use the accompanying
Q175: Table 3-4<br>Brenda and Eric run a business
Q177: Table 3-3<br> <img src="https://d2lvgg3v3hfg70.cloudfront.net/TB2178/.jpg" alt="Table 3-3
Q178: Use the accompanying table to answer the
Q179: Figure 3-1<br> <img src="https://d2lvgg3v3hfg70.cloudfront.net/TB2178/.jpg" alt="Figure 3-1