Multiple Choice
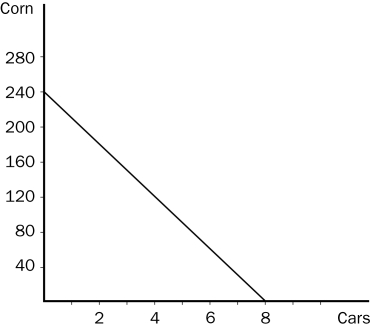
Figure 3-5 The graph below represents the various combinations of cars and corn that Country A could produce in a given month. (On the vertical axis, corn is measured in bushels.)

-Refer to Figure 3-5.The fact that the line slopes downward reflects the fact that
A) for Country A, it is more costly to produce a car than it is to produce a bushel of corn.
B) Country A will produce more cars and fewer bushels of corn as time goes by.
C) Country A faces a tradeoff between producing cars and producing corn.
D) Country A should specialize in producing corn.
Correct Answer:

Verified
Correct Answer:
Verified
Q86: Trade between countries<br>A)allows each country to consume
Q91: Differences in opportunity cost allow for gains
Q159: Without trade,<br>A)a country is better off because
Q160: Table 3-5<br> <img src="https://d2lvgg3v3hfg70.cloudfront.net/TB2178/.jpg" alt="Table 3-5
Q162: Figure 3-1<br> <img src="https://d2lvgg3v3hfg70.cloudfront.net/TB2178/.jpg" alt="Figure 3-1
Q163: Table 3-5<br> <img src="https://d2lvgg3v3hfg70.cloudfront.net/TB2178/.jpg" alt="Table 3-5
Q165: Table 3-1<br> <img src="https://d2lvgg3v3hfg70.cloudfront.net/TB2178/.jpg" alt="Table 3-1
Q166: These figures illustrate the production possibilities available
Q167: Table 3-3<br> <img src="https://d2lvgg3v3hfg70.cloudfront.net/TB2178/.jpg" alt="Table 3-3
Q168: Recently,it has been suggested by researchers that