Multiple Choice
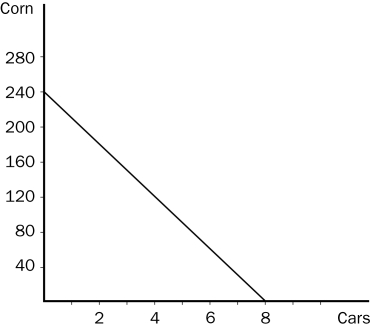
Figure 3-5 The graph below represents the various combinations of cars and corn that Country A could produce in a given month. (On the vertical axis, corn is measured in bushels.)

-Refer to Figure 3-5.Which of the following combinations of cars and corn could Country A produce in a given month?
A) 7 cars and 40 bushels of corn
B) 5 cars and 92 bushels of corn
C) 3 cars and 165 bushels of corn
D) 2 cars and 180 bushels of corn
Correct Answer:

Verified
Correct Answer:
Verified
Q8: Suppose the United States has a comparative
Q85: Mike and Sandy are two woodworkers who
Q143: Figure 3-3<br> <img src="https://d2lvgg3v3hfg70.cloudfront.net/TB2178/.jpg" alt="Figure 3-3
Q144: Table 3-5<br> <img src="https://d2lvgg3v3hfg70.cloudfront.net/TB2178/.jpg" alt="Table 3-5
Q146: Ben bakes bread and Shawna knits sweaters.Ben
Q149: These figures illustrate the production possibilities available
Q150: Assume that Greece has a comparative advantage
Q151: Figure 3-3<br> <img src="https://d2lvgg3v3hfg70.cloudfront.net/TB2178/.jpg" alt="Figure 3-3
Q152: The production possibilities frontier is a downward-sloping
Q153: Table 3-4<br>Brenda and Eric run a business