Multiple Choice
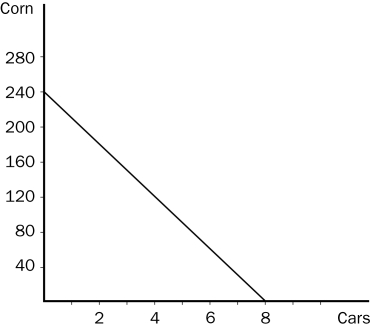
Figure 3-5 The graph below represents the various combinations of cars and corn that Country A could produce in a given month. (On the vertical axis, corn is measured in bushels.)

-Refer to Figure 3-5.Which of the following combinations of cars and corn could Country A not produce in a given month?
A) 6 cars and 60 bushels of corn
B) 4 cars and 120 bushels of corn
C) 3 cars and 160 bushels of corn
D) 1 car and 210 bushels of corn
Correct Answer:

Verified
Correct Answer:
Verified
Q8: Figure 3-3<br> <img src="https://d2lvgg3v3hfg70.cloudfront.net/TB2178/.jpg" alt="Figure 3-3
Q9: Table 3-5<br> <img src="https://d2lvgg3v3hfg70.cloudfront.net/TB2178/.jpg" alt="Table 3-5
Q11: Table 3-5<br> <img src="https://d2lvgg3v3hfg70.cloudfront.net/TB2178/.jpg" alt="Table 3-5
Q12: Table 3-5<br> <img src="https://d2lvgg3v3hfg70.cloudfront.net/TB2178/.jpg" alt="Table 3-5
Q15: A production possibilities frontier will be a
Q17: Use the accompanying table to answer the
Q18: For the following question(s), use the accompanying
Q27: Absolute advantage is found by comparing different
Q72: The producer who has the smaller opportunity
Q90: Some countries win in international trade, while