Multiple Choice
Figure 5-2
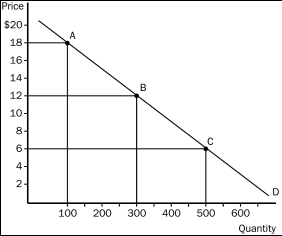
-Refer to Figure 5-2.The price elasticity of demand between point A and point B,using the midpoint method,is
A) 1.
B) 1.5.
C) 2.
D) 2.5.
Correct Answer:

Verified
Correct Answer:
Verified
Q12: Holding all other factors constant and using
Q22: When demand is inelastic, a decrease in
Q134: A decrease in supply will cause the
Q152: Figure 5-6<br> <img src="https://d2lvgg3v3hfg70.cloudfront.net/TB2178/.jpg" alt="Figure 5-6
Q153: Figure 5-4<br> <img src="https://d2lvgg3v3hfg70.cloudfront.net/TB2178/.jpg" alt="Figure 5-4
Q154: Table 5-2<br> <img src="https://d2lvgg3v3hfg70.cloudfront.net/TB2178/.jpg" alt="Table 5-2
Q156: Farm programs that pay farmers not to
Q160: If a person only occasionally buys a
Q161: Which of the following statements about the
Q230: The price elasticity of demand changes as