Multiple Choice
Figure 5-7
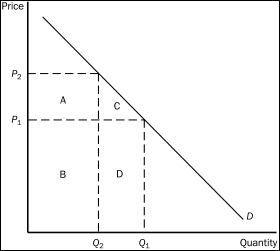
-Refer to Figure 5-7.Total revenue when the price is P₁ is represented by the area(s)
A) B + D.
B) A + B.
C) C + D.
D) D.
Correct Answer:

Verified
Correct Answer:
Verified
Q31: If the quantity supplied responds only slightly
Q47: As price elasticity of supply increases,the supply
Q78: When studying how some event or policy
Q79: Figure 5-9<br> <img src="https://d2lvgg3v3hfg70.cloudfront.net/TB2178/.jpg" alt="Figure 5-9
Q80: Figure 5-3<br> <img src="https://d2lvgg3v3hfg70.cloudfront.net/TB2178/.jpg" alt="Figure 5-3
Q83: Technological advances in wheat production can lower
Q84: If,for two goods,the cross-price elasticity of demand
Q85: Table 5-2<br> <img src="https://d2lvgg3v3hfg70.cloudfront.net/TB2178/.jpg" alt="Table 5-2
Q103: The price elasticity of demand is defined
Q275: Economists compute the price elasticity of demand