Multiple Choice
Figure 5-8. A demand curve is shown on the graph below. On the graph, Q represents quantity demanded and P represents price.
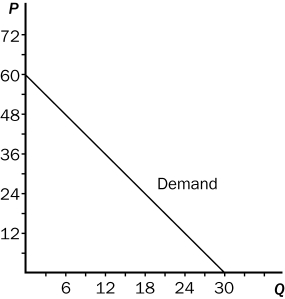
-Refer to Figure 5-8.The maximum value of total revenue corresponds to a price of
A) $18.
B) $30.
C) $42.
D) $48.
Correct Answer:

Verified
Correct Answer:
Verified
Q1: OPEC successfully raised the world price of
Q5: Normal goods have negative income elasticities of
Q11: In the market for oil in the
Q74: Cross-price elasticity of demand measures how<br>A)the price
Q88: Suppose good X has a negative income
Q218: When a supply curve is relatively flat,<br>A)
Q226: Figure 5-5<br> <img src="https://d2lvgg3v3hfg70.cloudfront.net/TB2178/.jpg" alt="Figure 5-5
Q228: Which of the following expressions is valid
Q232: Using the midpoint method,compute the elasticity of
Q399: The discovery of a new hybrid wheat