Multiple Choice
Figure 5-8. A demand curve is shown on the graph below. On the graph, Q represents quantity demanded and P represents price.
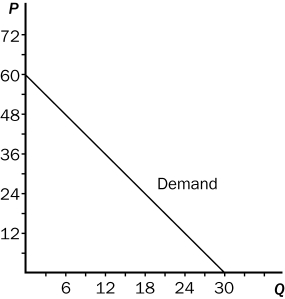
-Refer to Figure 5-8.Demand is unit elastic between prices of
A) $18 and $24.
B) $24 and $30.
C) $24 and $36.
D) $30 and $36.
Correct Answer:

Verified
Correct Answer:
Verified
Q17: When demand is perfectly inelastic,the price elasticity
Q43: If a change in the price of
Q52: When we move upward and to the
Q56: Figure 5-10<br> <img src="https://d2lvgg3v3hfg70.cloudfront.net/TB2178/.jpg" alt="Figure 5-10
Q59: Figure 5-2<br> <img src="https://d2lvgg3v3hfg70.cloudfront.net/TB2178/.jpg" alt="Figure 5-2
Q75: If a 30 percent change in price
Q108: When the Shaffers had a monthly income
Q178: Last year,Joan bought 50 pounds of hamburger
Q222: Elasticity of demand is closely related to
Q286: In January the price of widgets was