Multiple Choice
Figure 5-8. A demand curve is shown on the graph below. On the graph, Q represents quantity demanded and P represents price.
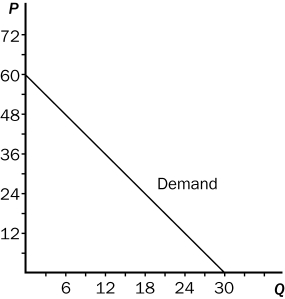
-Refer to Figure 5-8.Using the midpoint method,between prices of $48 and $54,price elasticity of demand is about
A) 0.92.
B) 3.89.
C) 4.33.
D) 5.67.
Correct Answer:

Verified
Correct Answer:
Verified
Q22: When demand is inelastic, a decrease in
Q73: Assume that a 4 percent increase in
Q75: Demand for a good is said to
Q83: Demand is inelastic if elasticity is<br>A) less
Q164: Which of the following expressions represents a
Q165: When the local used bookstore prices economics
Q169: According to a Los Angeles Times article
Q171: Figure 5-1<br> <img src="https://d2lvgg3v3hfg70.cloudfront.net/TB2178/.jpg" alt="Figure 5-1
Q244: An increase in price causes an increase
Q481: The greater the price elasticity of demand,the<br>A)