Multiple Choice
Figure 5-12
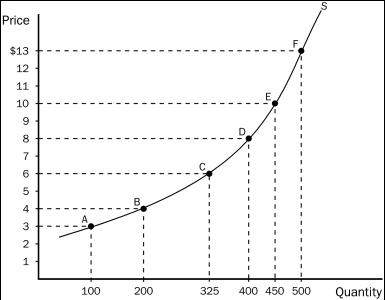
-Refer to Figure 5-12.Using the midpoint method,what is the price elasticity of supply between points B and C?
A) 1.67
B) 1.19
C) 0.84
D) 0.61
Correct Answer:

Verified
Correct Answer:
Verified
Related Questions
Q28: For which of the following goods is
Q79: When small changes in price lead to
Q80: Income elasticity of demand measures how<br>A)the quantity
Q168: The flatter the demand curve that passes
Q274: Figure 5-10<br> <img src="https://d2lvgg3v3hfg70.cloudfront.net/TB2178/.jpg" alt="Figure 5-10
Q276: Figure 5-6<br> <img src="https://d2lvgg3v3hfg70.cloudfront.net/TB2178/.jpg" alt="Figure 5-6
Q277: For which of the following types of
Q279: The case of perfectly elastic demand is
Q282: Figure 5-8. A demand curve is shown
Q307: If the price elasticity of demand for