Multiple Choice
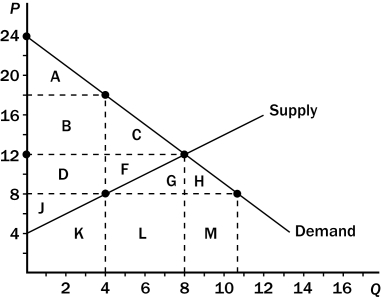
Figure 8-7 The graph below represents a $10 per unit tax on a good. On the graph, Q represents quantity and P represents price.

-Refer to Figure 8-7.One effect of the tax is to
A) reduce consumer surplus by $36.
B) reduce producer surplus by $24.
C) create a deadweight loss of $20.
D) All of the above are correct.
Correct Answer:

Verified
Correct Answer:
Verified
Q36: Scenario 8-1<br>Ryan would be willing to pay
Q39: A tax placed on buyers of tires
Q40: Scenario 8-2<br>Tom mows Stephanie's lawn for $25.
Q40: Taxes on labor encourage all of the
Q42: For Henry George's single tax on land
Q43: Suppose a tax is imposed on the
Q44: Figure 8-5<br> <img src="https://d2lvgg3v3hfg70.cloudfront.net/TB2178/.jpg" alt="Figure 8-5
Q46: For Henry George's land-tax argument to be
Q70: When a tax is levied on a
Q165: The most important tax in the U.S.