Multiple Choice
Figure 10-8
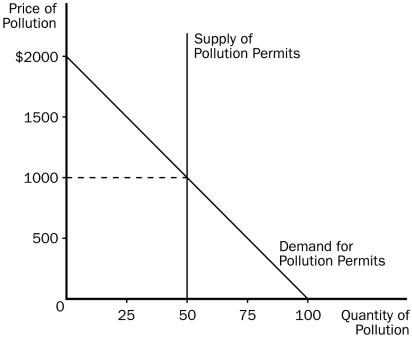
-Refer to Figure 10-8.This graph shows the market for pollution when permits are issued to firms and traded in the marketplace.The equilibrium price of pollution is
A) $50
B) $500
C) $1,000
D) $2,000
Correct Answer:

Verified
Correct Answer:
Verified
Related Questions
Q12: Suppose that electricity producers create a negative
Q18: This figure reflects the market for outdoor
Q20: Why can't private individuals always internalize an
Q66: The least expensive way to clean up
Q102: A dentist shares an office building with
Q201: One reason that private solutions to externalities
Q317: Suppose that flu shots create a positive
Q350: Suppose that a negative externality is created
Q354: According to the Coase theorem, in the
Q507: Markets are often inefficient when negative externalities