Multiple Choice
Figure 13-2
The figure below depicts a total cost function for a firm that produces cookies.
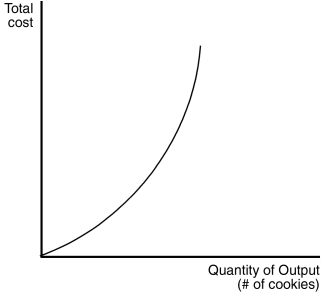
-Refer to Figure 13-2.The changing slope of the total cost curve reflects
A) decreasing average variable cost.
B) decreasing average total cost.
C) decreasing marginal product.
D) increasing fixed cost.
Correct Answer:

Verified
Correct Answer:
Verified
Q28: Those things that must be forgone to
Q29: Harry's Hotdogs is a small street vendor
Q30: Table 13-5<br> <img src="https://d2lvgg3v3hfg70.cloudfront.net/TB2178/.jpg" alt="Table 13-5
Q32: Table 13-8<br> <img src="https://d2lvgg3v3hfg70.cloudfront.net/TB2178/.jpg" alt="Table 13-8
Q35: Table 13-7<br>Teacher's Helper is a small company
Q37: Which of the following factors is most
Q38: Figure 13-7<br> <img src="https://d2lvgg3v3hfg70.cloudfront.net/TB2178/.jpg" alt="Figure 13-7
Q159: Average total cost and marginal cost are
Q201: The fact that many inputs are fixed
Q579: Marginal cost tells us the<br>A)value of all