Multiple Choice
Figure 13-6
The curves below reflect information about the cost structure of a firm.
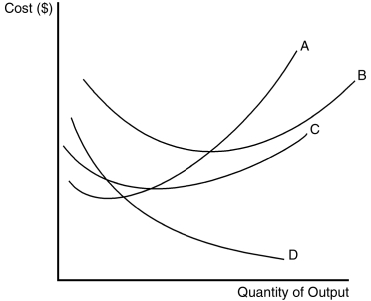
-Refer to Figure 13-6.Which of the curves is most likely to represent average total cost?
A) A
B) B
C) C
D) D
Correct Answer:

Verified
Correct Answer:
Verified
Q6: Table 13-10<br>Consider the following table of long-run
Q7: Suppose that for a particular business there
Q9: Smith Tire Company has total fixed costs
Q12: According to the law of supply,<br>A)firms' production
Q13: Figure 13-2<br>The figure below depicts a total
Q14: Table 13-7<br>Teacher's Helper is a small company
Q15: Table 13-8<br> <img src="https://d2lvgg3v3hfg70.cloudfront.net/TB2178/.jpg" alt="Table 13-8
Q16: Figure 13-6<br>The curves below reflect information about
Q132: Explicit costs<br>A) require an outlay of money
Q437: When average cost is greater than marginal