Multiple Choice
Figure 14-2
The figure below depicts the cost structure of a profit-maximizing firm in a competitive market.
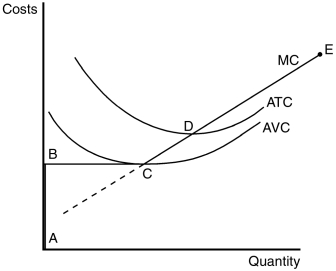
-Refer to Figure 14-2.Which line segment best reflects the short-run supply curve for this firm?
A) ABCE
B) CD
C) DE
D) BCD
Correct Answer:

Verified
Correct Answer:
Verified
Q42: Figure 14-4<br>The figure below depicts the cost
Q43: Table 14-5<br> <img src="https://d2lvgg3v3hfg70.cloudfront.net/TB2178/.jpg" alt="Table 14-5
Q45: Profit-maximizing firms enter a competitive market when,
Q49: When firms have an incentive to exit
Q50: In a long-run equilibrium,it is possible that
Q64: Describe the difference between average revenue and
Q134: In a perfectly competitive market, the horizontal
Q172: A firm in a competitive market will
Q176: In the long run, a competitive market
Q253: Use a graph to demonstrate the circumstances