Multiple Choice
Figure 21-2
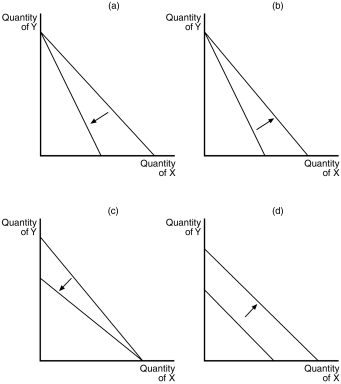
-Refer to Figure 21-2.Which of the graphs in the figure could reflect a decrease in the prices of both goods?
A) graph (a)
B) graph (b)
C) graph (c)
D) graph (d)
Correct Answer:

Verified
Correct Answer:
Verified
Q17: Which of the following is a property
Q93: Figure 21-1<br> <img src="https://d2lvgg3v3hfg70.cloudfront.net/TB2178/.jpg" alt="Figure 21-1
Q95: Draw indifference curves that reflect the following
Q96: The following diagram shows two budget lines:
Q99: Figure 21-5<br> <img src="https://d2lvgg3v3hfg70.cloudfront.net/TB2178/.jpg" alt="Figure 21-5
Q103: Consider the budget constraint between "spending today"
Q333: In the work-leisure model,suppose consumption and leisure
Q393: Indifference curves that cross would suggest that<br>A)the
Q447: The substitution effect of a wage decrease
Q536: A decrease in a consumer's income<br>A)increases the