Multiple Choice
Figure 21-5
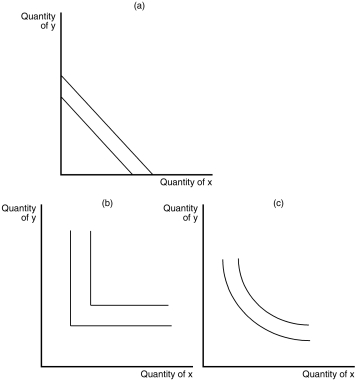
-Refer to Figure 21-5.Which of the graphs shown represent indifference curves for perfect substitutes?
A) graph (a)
B) graph (b)
C) graph (c)
D) None of the above is correct.
Correct Answer:

Verified
Correct Answer:
Verified
Q32: Figure 21-4<br> <img src="https://d2lvgg3v3hfg70.cloudfront.net/TB2178/.jpg" alt="Figure 21-4
Q33: When two goods are perfect complements they
Q34: If the consumer's income and all prices
Q37: Figure 21-6<br> <img src="https://d2lvgg3v3hfg70.cloudfront.net/TB2178/.jpg" alt="Figure 21-6
Q40: Ken consumes two goods,beer and pretzels.A beer
Q129: Suppose a consumer is currently spending all
Q218: What are the two effects of a
Q303: Which of the following is most likely
Q317: Beer and pretzels are normal goods.When the
Q479: Higher education is a normal good. If