Multiple Choice
The following diagram shows one indifference curve representing the preferences for goods x and y for one consumer. 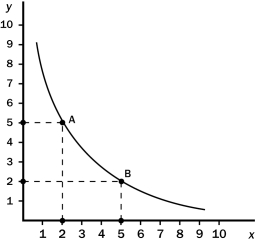
What is the marginal rate of substitution between points A and B?
A) 2/5
B) 1
C) 5/2
D) 3
Correct Answer:

Verified
Correct Answer:
Verified
Q15: Figure 21-2<br> <img src="https://d2lvgg3v3hfg70.cloudfront.net/TB1272/.jpg" alt="Figure 21-2
Q82: As more units of an item are
Q150: A rational consumer is likely to have
Q152: Answer the following questions based on the
Q157: Suppose the price of good x falls
Q158: Consider the indifference curve map and budget
Q178: The substitution effect of a price change
Q198: Indifference curves graphically represent<br>A)an income level sufficient
Q262: The labor supply curve may have a
Q491: The two "goods" used when economists analyze