Multiple Choice
The following diagram shows one indifference curve representing the preferences for goods x and y for one consumer. 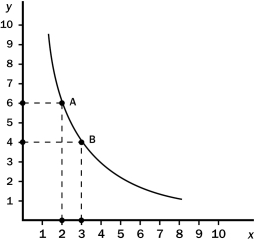
What is the marginal rate of substitution between points A and B?
A) 1/2
B) 4/3
C) 2
D) 3
Correct Answer:

Verified
Correct Answer:
Verified
Related Questions
Q105: If a consumer wants less of a
Q140: If a good is a Giffen good,then<br>A)
Q201: A family on a trip budgets $800
Q228: Good x is an inferior good,but not
Q229: At the optimum,the consumer chooses consumption of
Q230: The relationship between the marginal utility that
Q231: In the upward-sloping portion of the individual
Q237: Scenario 21-3<br>Diane knows that she will ultimately
Q284: Pepsi and pizza are normal goods. When
Q568: Giffen goods have positively-sloped demand curves because