Multiple Choice
The following diagram shows two budget lines: A and B. 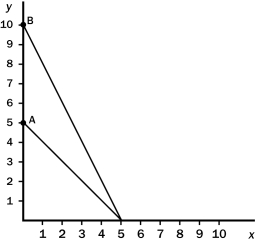
Which of the following could explain the change in the budget line from A to B?
A) A decrease in the price of x.
B) An increase in the price of y.
C) A decrease in the price of y.
D) More than one of the above could explain this change.
Correct Answer:

Verified
Correct Answer:
Verified
Q70: The income effect of a price change
Q73: Pepsi and pizza are normal goods.When the
Q119: Scenario 21-3<br>Diane knows that she will ultimately
Q138: Assume that a person consumes two goods,
Q139: The substitution effect of a price change
Q140: Figure 21-3<br> <img src="https://d2lvgg3v3hfg70.cloudfront.net/TB2178/.jpg" alt="Figure 21-3
Q141: John is planning ahead for retirement in
Q144: A Giffen good can be explained as
Q146: When considering her budget,the highest indifference curve
Q148: Assume that a college student spends her