Multiple Choice
Use the two graphs in the diagram to answer the following questions.
Figure 35-3
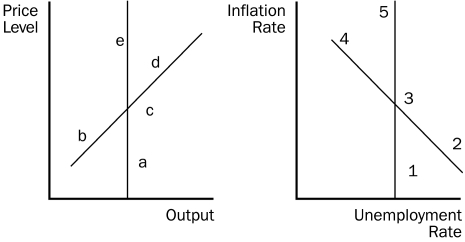
-Refer to Figure 35-3.Starting from c and 3,in the long run,an increase in money supply growth moves the economy to
A) a and 1.
B) back to c and 3.
C) d and 4.
D) e and 5.
Correct Answer:

Verified
Correct Answer:
Verified
Q6: An increase in expected inflation shifts the<br>A)short-run
Q11: The position of the long-run Phillips curve
Q14: Use the graph below to answer the
Q15: Monetary Policy in Hyperion<br>In Hyperion the Department
Q21: If policymakers decrease aggregate demand,then in the
Q22: During 1999 and 2000 the Federal Open
Q23: In the mid and late 1990s,<br>A)aggregate supply
Q54: Friedman and Phelps argued<br>A)that in the long
Q105: In the long run,an increase in the
Q221: Friedman and Phelps believed that the natural