Multiple Choice
Suppose a plot of sales data over time appears to follow an S-shape as illustrated on the next page. 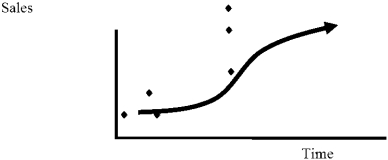 Which of the following is likely that the best forecasting functional form to use for sales data above?
A) A linear trend, Sales = a + bT
B) A quadratic shape in T, using T-squared as another variable, Sales = a + bT + cT2.
C) A semi-log form as sales appear to be growing at a constant percentage rate, Ln Sales = a + bT
D) A cubic shape in T, using T-squared and T-cubed as variables, Sales = a + bT + cT2 + dT3.
E) A quadratic shape in T and T-squared as variables, Sales = a + bT + cT2
Correct Answer:

Verified
Correct Answer:
Verified
Q1: Emma uses a linear model to forecast
Q3: US and Canada can both grow wheat
Q4: Examine the plot of data. <img src="https://d2lvgg3v3hfg70.cloudfront.net/TB9871/.jpg"
Q5: The Accuweather Corporation manufactures barometers and thermometers
Q6: If the domestic prices for traded
Q7: Milner Brewing Company experienced the following monthly