Multiple Choice
Use the REGRESSION feature on a graphing calculator:
-As the number of farms has decreased in South Carolina, the average size of the remaining farms has grown larger, as shown below.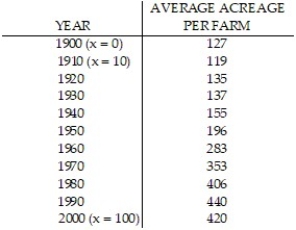
Let x represent the number of years since 1900. Use a graphing calculator to fit a quadratic function to the data. Round your answer to five decimal places.
A) 
B) 
C) 
D) 
Correct Answer:

Verified
Correct Answer:
Verified
Q106: Use a calculator to evaluate the expression.
Q107: Find the function value:<br>-Find f( 4) when
Q108: Find the vertex form for the quadratic
Q109: Give the domain and range of
Q110: For the rational function below (i) Find
Q112: Determine whether the graph is the graph
Q113: Give the domain and range of
Q114: <img src="https://d2lvgg3v3hfg70.cloudfront.net/TB10044/.jpg" alt=" " class="answers-bank-image d-inline" rel="preload"
Q115: Determine whether the relation represents a function.
Q116: Use point-by-point plotting to sketch the graph